
Levels of Innovation Metrics
When people say they want to measure innovation or implement innovation accounting, they are often talking about a number of different things, and trying to answer a broad variety of questions:
- Is this team succeeding?
- Is this project going to succeed?
- How much money are we going to make?
- Is this company good at innovation?
- Is this person a good innovator?
These aren’t just different questions, they are questions that apply to different areas. For both startups and corporations alike, innovation accounting is often used as a vague, catch-all term for measuring innovation capabilities, projects, people, and organizations.
Sometimes you want to measure the progress of a project from idea to product/market fit.
Sometimes you want to measure innovation teams or even the KPIs of individuals.
Sometimes you want to measure the effectiveness of a company’s innovation program.

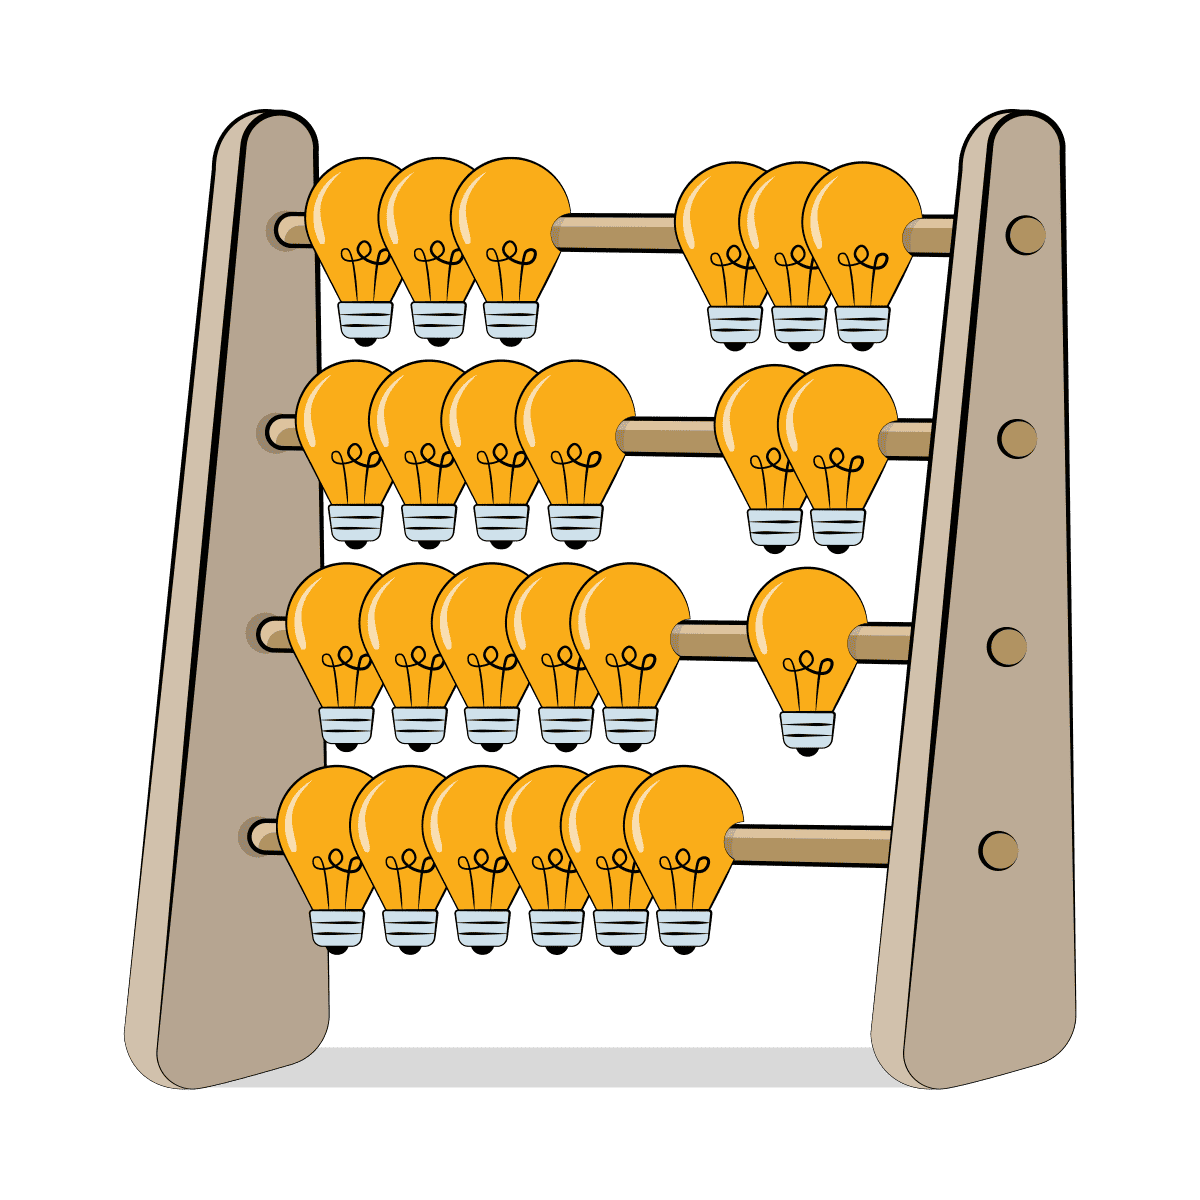
Measuring the number of ideas you have flowing through your innovation pipeline is a lot different than measuring product / market fit on a specific project, which is a lot different from measuring people, which is a lot different from measuring systems.
Measuring a team’s innovation capability by the same metrics you use to measure the project’s success isn’t going to get you anywhere. After all, the team can quickly and successfully determine that a particular idea is a bad one — based on customer discovery interviews, user engagement, and experiment results on a landing page, that a project should be shut down. But a failing project is not an indicator of a failing team, it’s an indicator of a successfully tested hypothesis.
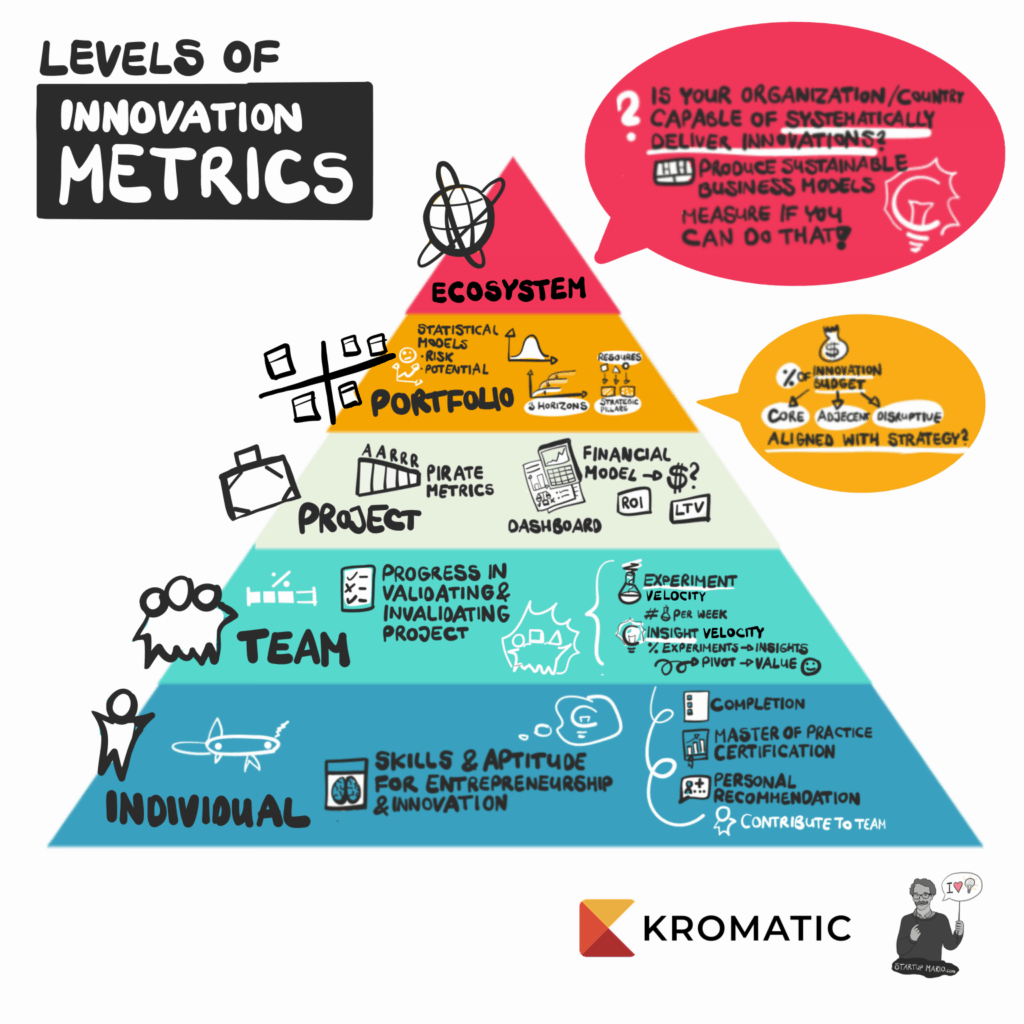
So when we talk about measuring innovation, it’s important to understand what level we’re talking about:
- Individuals
- Teams
- Projects
- Portfolios
- Ecosystems
Individuals
When we talk about an individual, we’re talking about measuring that person’s existing skills and their aptitude for entrepreneurship.
- Is this person a good innovator?
- Do they have the skills to contribute to an innovation team?
- Do they know the difference between a concierge test and a Wizard of Oz test?
In other words, what is their innovation skill set?

An individual skill set within an innovation team can be quantified through established learning and development programs. HR teams are already familiar with this type of measurement. There is usually some sort of completion metric for coursework, and then certification for mastery of a specific skill.
Of course there is no substitute for experience (which is why our innovation programs and certification are built around students’ real-world projects). Even without professional certifications, someone’s innovation KPIs can center on the more qualitative measurement of previous performance. Feedback from 1:1s, 360 peer reviews, and traditional performance review practices can provide valuable insights about who shows initiative and interest in entrepreneurship, including what a candidate specifically contributed to previous innovation projects, and to what extent they are recommended by their peers and team leaders.
These traditional systems may not value entrepreneurship if they are designed by people who don’t value entrepreneurship. But at least the metrics are clearly targeted at individuals, and not confused for the performance of an innovation project or the ecosystem as a whole.
Teams
The obvious question when it comes to measuring innovation at the team level is “How are their innovation projects going?”
If they are going well, great job! You’re successful innovators! Here’s your medal and pep talk by the CEO!
If they are going poorly, oh no! Here’s a cardboard box and your severance check!
This is not the right way to measure your innovation team.
The first duty of an innovation team isn’t to “succeed” at their projects, it’s to measure whether those projects are viable. So if our innovation team proposed a project, tested it, and found that it didn’t pass their experiments, they did not “fail” at innovation, they succeeded at invalidating a hypothesis (possibly saving the company a lot of money on an MVP).

To avoid confusing the success of the project with the success of the team, we need to separate the two.
At this level, we should ask:
- Is this the right team to work on an innovation project?
- Does the team have the right combination of skill sets? Is this team able to quickly validate or invalidate innovation ideas?
To answer these questions, we can look at experiment velocity and insight velocity. These terms refer to the number of experiments the team is running each week, and the number insights those experiments generate.
As a rule of thumb, if a team is not able to run at least one experiment per sprint, there is something wrong. (We encourage one experiment per week.)
If a team can’t meet this goal, it doesn’t necessarily mean that the team is to blame. They could be missing a team member, or they could be multi-tasked with several other projects, or they could be blocked by legal or other stakeholders. But they are stuck and may need some help.
Similarly, those experiments should be generating at least one insight per week. Well-designed and well-run experiments should tell us whether to move forward with the project, pivot on the value proposition, or cancel the project altogether. They should tell us something.
 An insight could be realizing that a value proposition is true or false. It could be reducing the margin of error on the acquisition rate from +/- 8% to +/- 4%. It could be an insight about the right customer segment to target. Any insight that reduces uncertainty is valid.
It’s important to note here that the benchmark for team velocity metrics should be at least one experiment and insight per week. But remember, a team that runs 20 comprehension tests is not necessarily any better than a team that runs one set of usability tests. One insight that the value proposition is wrong is better than 20 insights on the aesthetic quality of a logo.
A team that generates steady streams of garbage data that doesn’t help with decision-making is not an effective innovation team. A team that knows how to run experiments and gather helpful data is.
Project
This is the holy grail of innovation accounting: to be able to tell if a project will or will not succeed. This is also the most controversial area of innovation metrics, and there isn’t a lot of agreement on how to best measure projects. It’s hard to have a consistent, agreed-upon way to measure something which, by definition, has never been seen before and might be completely disruptive. This is where the term innovation accounting truly belongs, where we ask the questions:
- Is this project going to succeed?
- Will it make money?
- Will it make an impact?
The traditional viewpoint is that the success of a project can only be measured by looking at the Return on Investment (ROI) or Net Present Value (NPV). Unfortunately, ROI can only be measured at the end of a project, and is not particularly useful for making a decision as to whether or not to invest on Day 1.
NPV is an ideal metric because it accounts for opportunity cost, but it only works if you have the data to feed into the formula. But at the beginning of a project, we don’t have the data, we only have guesses. If we could use a crystal ball to accurately predict NPV, we wouldn’t be having this discussion at all — everyone would be too busy successfully innovating.
So instead, many innovation consultants advocate the use of leading indicators of project success such as customer satisfaction and the product / market fit survey, or more specific industry metrics such as viral coefficient for social media companies or turnover for consumer goods.

While there is nothing wrong with those metrics, this is simply punting on the question. We can use the viral coefficient as a metric for social media companies because there is less uncertainty around the other financial metrics.
We know how much advertising we can sell per page view or per search. We know those advertising margins are low, so as a consequence, we know that the viral coefficient must be sufficient for exponential growth. We simply cannot afford paid advertising.
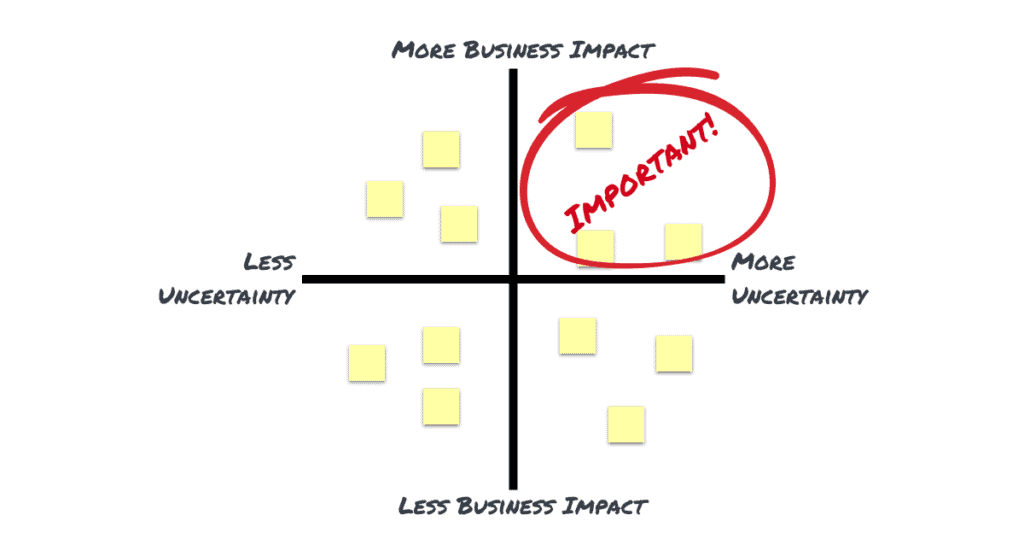
Whenever we have a key metric and a benchmark for an innovation project, it is just shorthand for a simple dictum: focus on areas of uncertainty.
For a new, disruptive business model where there are no benchmarks, the same thing applies. We can use traditional metrics such as NPV if we simply acknowledge the uncertainty. If we use standard financial modeling but accept a range of values for unknowns, there are statistical tools such as Monte Carlo analysis that will allow us to project a range of possible outcomes.
These statistical modelling tools are taught in business school, but are rarely used because of their difficulty. Like cellular biology and The Canterbury Tales, a lot of people learn this stuff but then forget about it because it doesn’t really apply to everyday life. But innovators can use these tools to great effect, and more modern software packages make statistical analysis simpler every year.
Early-stage innovation teams can construct the same financial models that a stable business can, but represent a range of uncertainty in the variables. This allows companies to use NPV calculations combined with Monte Carlo simulations to more accurately predict the possible outcomes of projects and make better investment decisions.
Put more simply, there’s nothing wrong with taking a guess if we acknowledge that it’s a guess. Guessing a single number for revenue is always going to be wrong. But by guessing a range, we increase our chances of being right.
A simple financial model that represents uncertainty can help us make better innovation investment decisions. The ability to help make decisions must be the basis for a true system of innovation accounting.

Portfolio
If we take all of those individual financial statements from all of those individual projects, we should be able to add them up and see what our portfolio is worth. A venture capitalist is not counting on an individual project to succeed. They place many bets and hope that 1 out of 10 pay back 100 times the investment.
If we’ve done our innovation accounting right on an individual project level, our portfolio should look like a well-diversified investment. The sum of all of our Monte Carlo simulations should be relatively predictable. We don’t know which projects will succeed and which will fail, but we know the total value should be within a range.
However, there are some other metrics worth looking at to understand our portfolio. They mostly revolve around a simple question: “Are we doing what we said we would do?”
If we look at the percentage of our R&D or innovation budgets going to core projects versus adjacent projects versus disruptive projects, we can see if those percentages are what was agreed to in our innovation and portfolio management strategy. If the numbers don’t line up (and they usually don’t), then it tells us that we’re not actually executing our desired innovation strategy.
More importantly, if we add up our current spending and investment, compare it to our planned innovation strategy, and then realize that we don’t have a planned innovation strategy…well then….better go make one.
Strategic alignment as a portfolio metric is also a very useful metric when looking at our innovation ecosystem as a whole.
Innovation Ecosystem
Ecosystem metrics are all about measuring whether or not your organization is capable of systematically delivering the innovations in your portfolio over time.
- Is our company capable of innovating?
- Can we systematically construct new business models over and over?
An individual’s job is to contribute to the team.
The team’s job is to validate or invalidate projects.
Those projects add up to your portfolio.
But the ecosystem is where and how all of these elements interact. It’s the environmental framework that innovation teams operate in.

If the object of innovation is to continuously produce sustainable business models, then our ecosystem is what makes innovation easier or harder.
While the innovation ecosystem contains some easily quantifiable metrics such as the average cost of running an innovation project, there are also soft elements such as culture that are more mysterious and seem unquantifiable. But like with most “unquantifiable” things, maybe we’re simply not putting enough effort into it.
A culture of fear can be measured on a Likert scale, or by the number of “failed” innovators that get passed over for promotion. Apathy can be measured in the amount of time allocated to innovation projects. Skills are already being measured by HR, and we can measure team performance by their velocity.
We can measure our portfolio through statistical simulation, and we can measure whether we are adhering to our strategy. The strength of our innovation community can be measured by their interactions, and we can measure our ability to improve our innovation ecosystem simply by measuring whether or not teams and executives are running retrospectives.
There are enough ways to measure innovation ecosystems that we had to write a booklet just to collect a sampling of them (and I’m writing a whole book around that booklet).
DOWNLOAD THE INNOVATION ECOSYSTEM BOOKLET
Measuring the innovation ecosystem as a whole is not what most innovation programs focus on. But for a company that truly wants to make innovation its core competence, creating an ecosystem dashboard is a core activity.
Measure Everything
When starting an innovation program, be clear about what you’re trying to measure. If you measure the wrong thing, it will only obscure the truth of whether you’re making progress.
For new innovation programs, focus on team metrics first. As teams gain velocity, they’ll need individuals to be upskilled and their mindsets shifted. But focusing only on individuals to the exclusion of the team will just create a bunch of skilled entrepreneurs ready to leave the company and become the competition.
As teams get faster and faster, it’s important to bring quantitative project metrics back in. Teams that focus too much on qualitative consumer insights can sometimes build great products that make no money.
More mature innovation programs should climb up the hierarchy of metrics, focusing on portfolio and finally ecosystem metrics as they scale up.
To keep the levels of innovation metrics clear, our good friend Startup Mario has made a poster you can download here as a reminder.
DOWNLOAD THE LEVELS OF INNOVATION METRICS POSTER
Lessons Learned
- Be clear about what you’re trying to measure.
- Measure everything: Individuals, Teams, Projects, Portfolio, Ecosystem.
- Innovation Accounting shouldn’t be vague — it requires real financial models and analysis.
- Work up the pyramid until you have a clear understanding of your entire ecosystem.


